


 60 / 140

November 2018
58 \
World Cement
The demonstration and installation of
monitoring equipment
In order to better understand and quantify the potential
benefits of this new filter media, the cement plant set out
to perform a trial comparing and contrasting different
filter media options. To perform the trial, the plant
selected four compartments within the 14-compartment
baghouse equipped with specific filter media types and
the appropriate monitoring instrumentation. For proper
filter drag evaluation and comparison, the plant needed
to monitor realtime airflow, temperature, and differential
pressure in each of the four modules, so each of the outlets
was equipped with pitot tubes and a thermocouple. Two
pitot tubes per outlet were used in an
effort to take into consideration any
potential flow distribution variation.
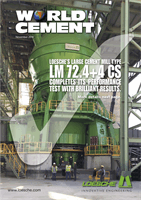
The general layout plan for the
monitoring equipment can be seen in
Figure 3.
The pitot tube total pressures and
static pressure were each combined in
a manifold to average the pressure and
then attached to a pressure transmitter
monitoring the velocity pressure. The
4 – 20 mA signal from the pressure
transmitters was sent back to the
plant’s main control room.
The compartment differential
pressure ports were also attached
to a pressure transmitter. As with
the pressure transmitter for velocity
pressure, the 4 – 20 mA signal from
the compartment differential pressure was also sent back
to the main control room. The velocity pressure, along
with the velocity measurement going through the known
area of the compartment outlet, allows for a calculation
of the actual airflow within the compartment. With
336 filters per compartment and each filter measuring
292 mm dia. x 10.5 m long, the actual air-to-cloth (a/c)
ratio can be calculated and this, taken together with the
compartment differential pressure as the numerator and
the actual a/c ratio as the denominator, provides a figure
for the actual filter drag at any moment in time from each
of the individual compartments. Based on the equation, the
units of filter drag are millimetres of water/cubic metre of
air/minute (mm w.g./m
3
/min).
The comparison of different filter media
The trial was targeted to begin during the plant’s 2017
winter outage, at which point all the filters in the baghouse
were 3 years into their anticipated 5 year effective filter
bag life. The trial was set up to compare four different
compartments, as outlined in Table 1.
Before the trial, it was anticipated that several of the
modules would require some metal fabrication and repair.
In order to prepare optimally for the baghouse filter media
trial, the three modules that would be getting new bags
at the start of the test (module A, 8, and 9) were stripped
of old bags. These modules were then inspected for any
critical thimble and structural metal repair and the repairs
were made. This included some thimble replacements,
access door frames, flange repairs, and repairing holes in
areas of the floor and walls of the compartments.
The compartments were then swept and vacuumed
before the installation of the three new compartments of
filter bags. The fourth compartment, which contained the
existing 3 year old filter bags, was also vacuumed to remove
any and all particulate dust and rust that had accumulated
on the floor of the baghouse.
Once the three different kinds of new filter bags
were installed and tensioned appropriately, all four test
compartments were leak checked using the fluorescent
Figure 3. Monitoring plan for trial.
Table 1.
The filter media type installed in each of the
four demonstration modules.
Compartment
Filter media
type
Life to date at
the beginning
of the trial
Module 6
Membrane
supplier 1
3 years old
–
standard drag
Module A
Membrane
supplier 1
Brand new
–
standard drag
Module 8
Membrane
supplier 2
Brand new
–
standard drag
Module 9
Membrane
supplier 2
Brand new
–
low
drag
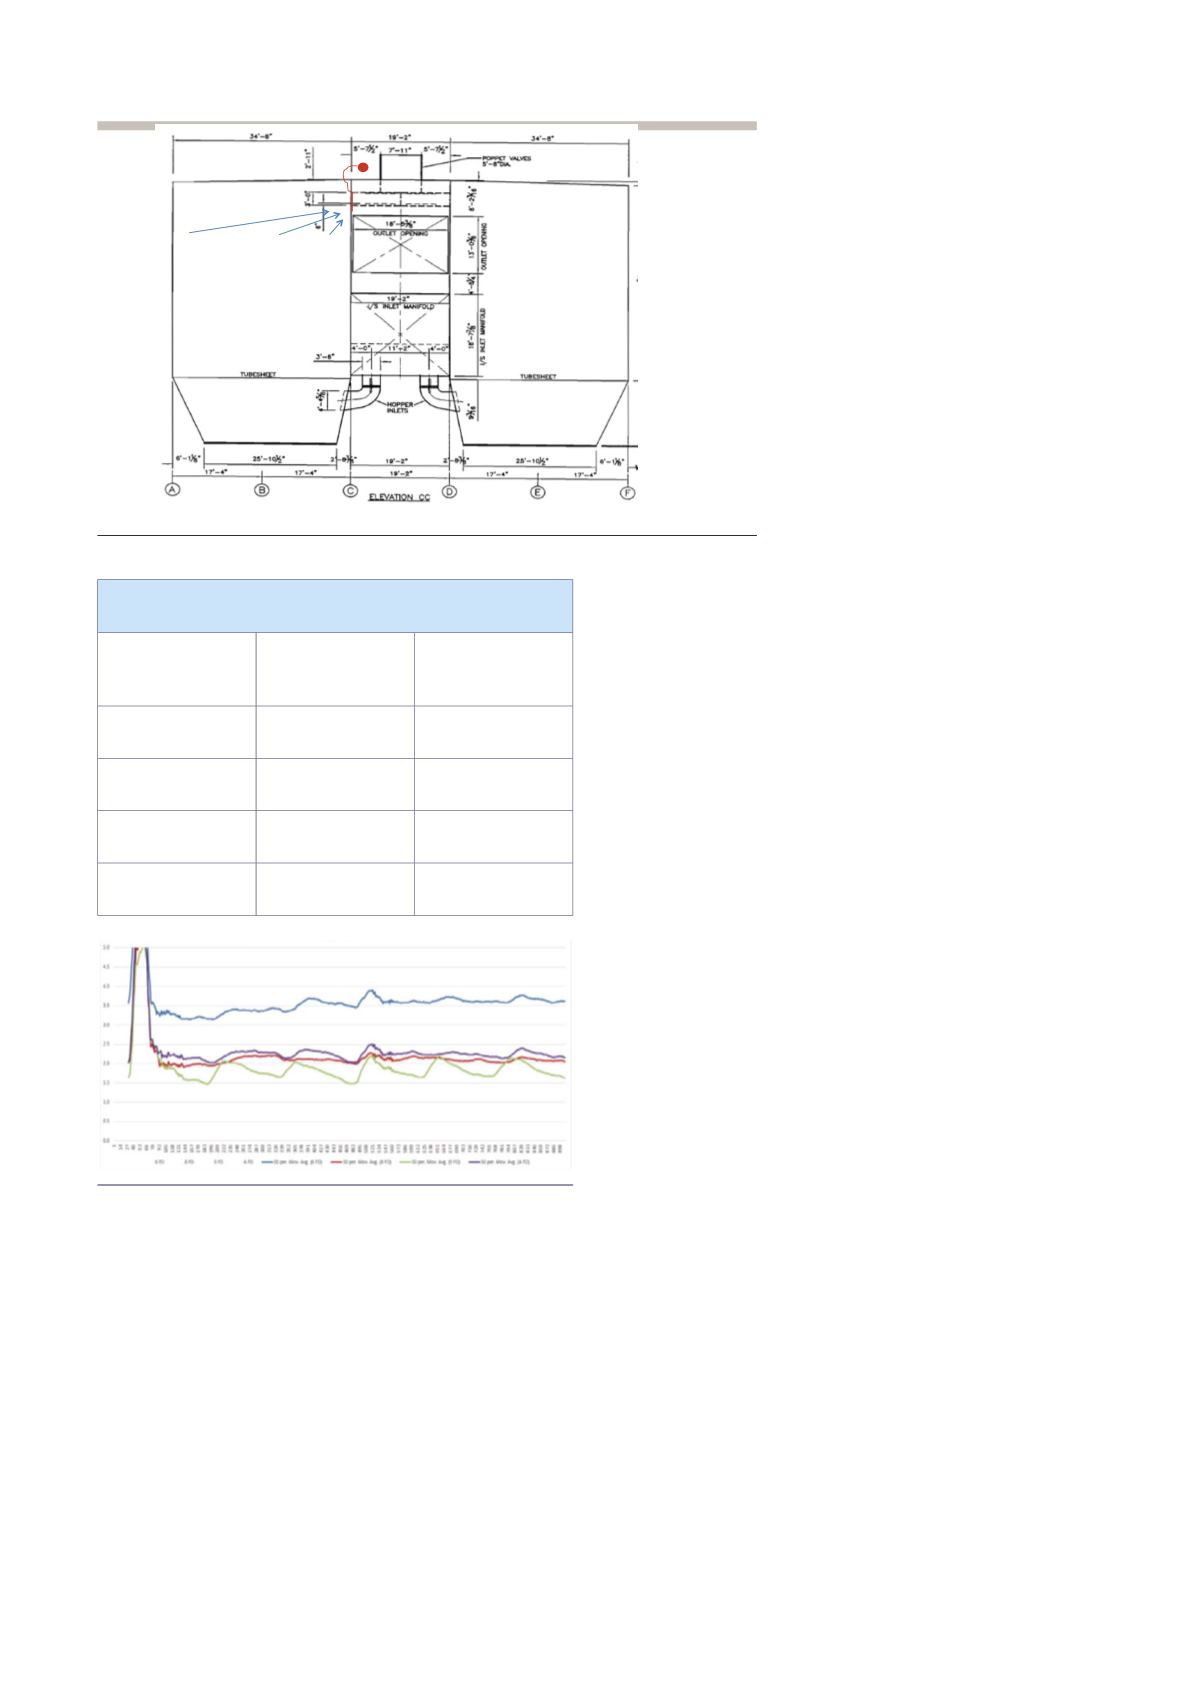
re&Associates
Figure 4. First set of filter drag data.