


 66 / 140

November 2018
64 \
World Cement
the correlation of acceleration sensor signals with
information specific to the process. With this correlation,
SKF can model multiple points of the operation and
predict, beforehand, possible failures that traditional
techniques would find impossible to detect.
Technological innovation
Currently, techniques that use a vast amount of
information are limited due to the quality of the data
(categorised) and its availability. In certain processes,
such as condition analysis, it is also important to obtain
relevant variables from sensors and control systems in
real time. Unfortunately, this is not possible in many
cases because of a low level of instrumentation or due
to IT security restrictions.
Bearing all of this in mind and being aware that
the path to technological advance will not be easy, the
following primary and secondary goals can be set:
Primary objectives
z
Deliver value to end-users through the enabling
of analytical applications and tools, which use
predictive models that can dynamically determine
the plants, systems, and asset’s health using process
variables to meet business objectives.
Secondary objectives
z
Allow the detection of deviations using operational
parameters.
z
Allow the prediction of faults using productive
programmes.
z
Learn from events with faults from a multivariable
point of view.
z
Allow the identification of recurring events.
z
Complement condition severity diagnostics
obtained via conventional methods.
Background and case studies
Vibrational analysis has proven to be successful at
many of SKF’s clients. They have had the opportunity
to try it firsthand and clients have realised that this
technique is valuable, as it has helped to keep their
equipment operating continually at the lowest
possible cost. Consequently, client interest in having
monitoring systems on more machines has grown,
as they want to replicate the same successful results.
This situation has triggered local units to design new
solutions, which in some cases have been implemented
successfully.
Technical information for different monitoring
projects that have incorporated the new solutions has
been collected and recorded. This information has been
made available thanks to the local areas that have been
responsible for these services in different countries.
The following two cases are clear examples of
how two important variables, vibrational analysis and
process data, when analysed together, can provide
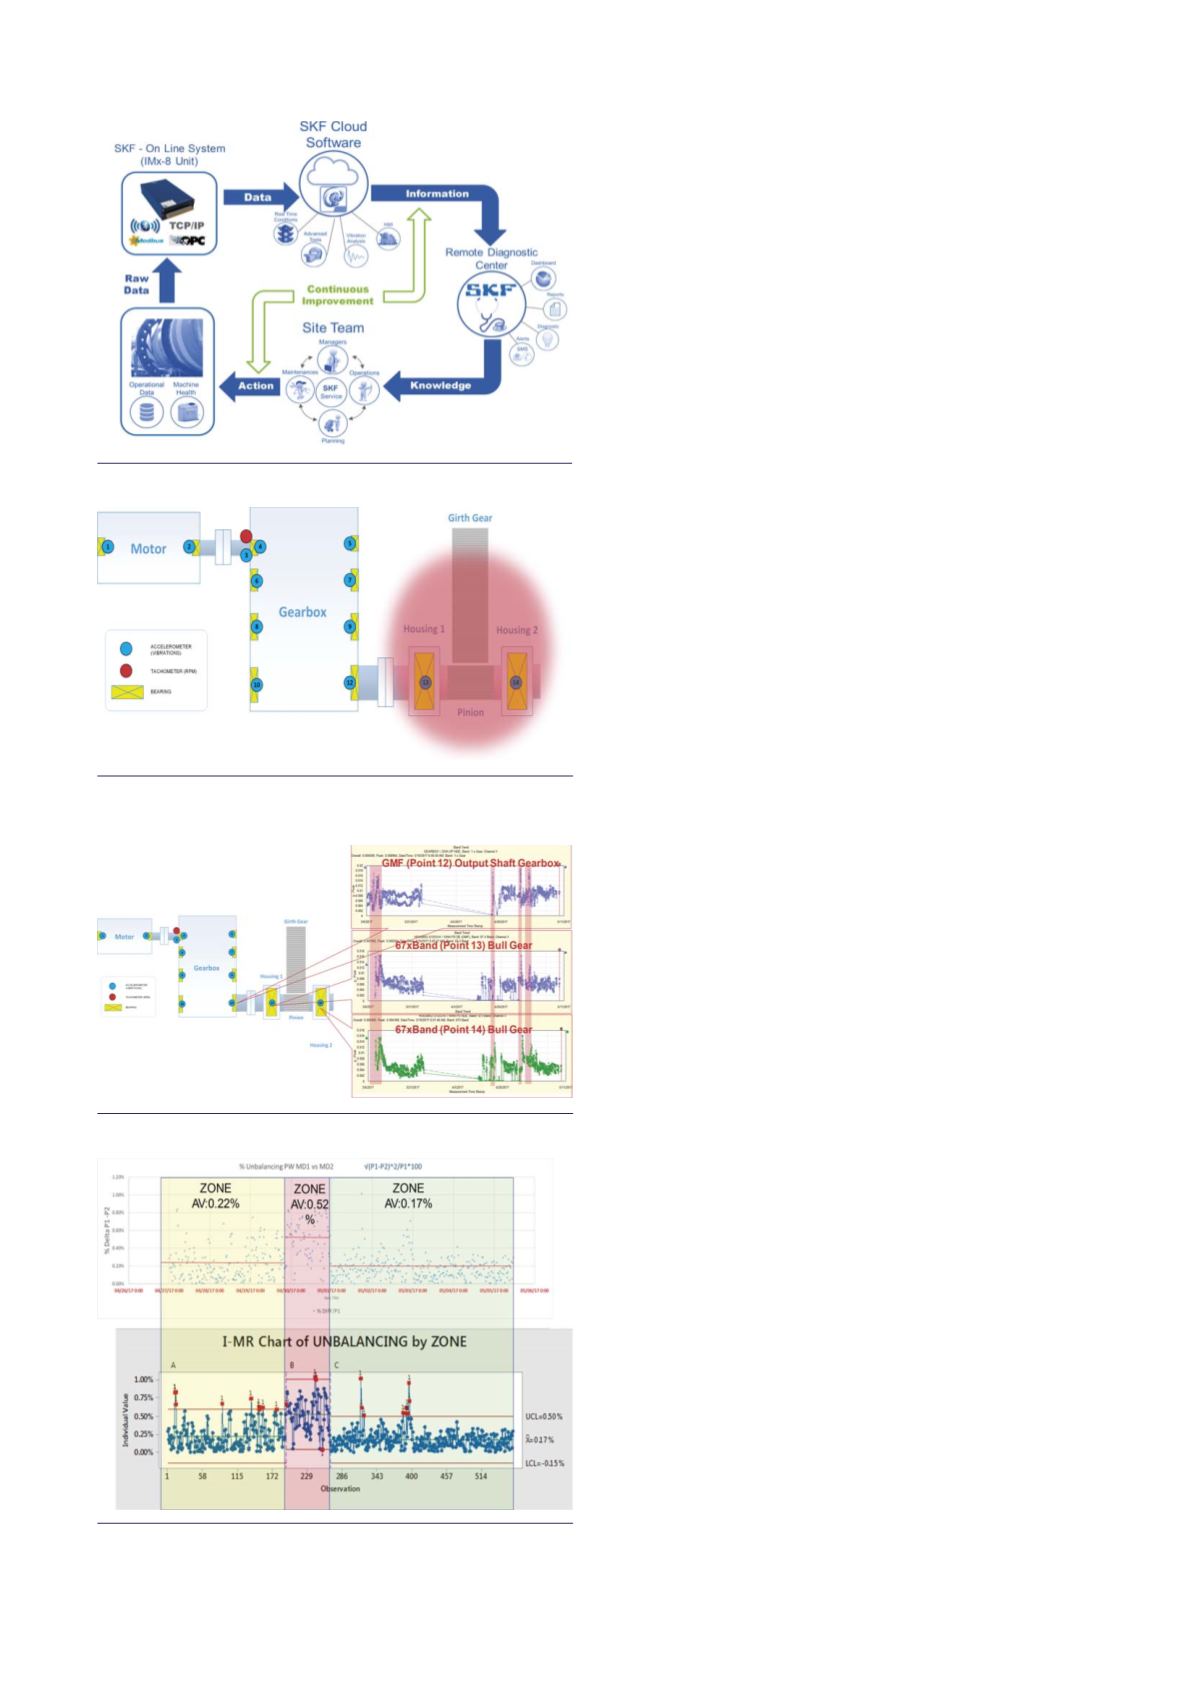
Figure 1. SKF Technological Solution Architecture.
Figure 2. Main drive rotatory kiln diagram of sensor’s
location.
Figure 3. GMF Trends for sensors 13 and 14.
Figure 4. Identification of unbalanced power zones.