


 16 / 84

North America 2018
14 \
World Cement
the around 7% growth of the infrastructure segment
(considering roads and highways only). The cost of building
has also increased: private housing permits in units
increased by 6% CAGR in the 2012 − 2017 period, whereas
in US dollar terms growth was three times higher.
Rated D+ by the American Society of Civil Engineers,
road infrastructure is in dire need of rehabilitation. The
issue is not lost on the Trump administration, which has
made the country’s “crumbling infrastructure” an aspect
of its campaign. Long anticipated, the administration’s
US$1.5 trillion plan is also surprisingly hands-off from a
federal perspective. The plan, deemed a “hocus-pocus”
plan by Kevin DeGood, Director of Infrastructure Policy
at the Liberal Centre for American Progress thinktank,
assumes that a US$200 billion federal investment would
lead to an extra US$1.5 trillion from the private sector,
and from the city and state level.
It is noteworthy to mention how the needle moved
in terms of infrastructure spending in 2017: investments by
US municipalities in infrastructure stood at
US$50.7 billion in the first seven months of 2017, lower
by almost 20% year-on-year. This clearly shows that
infrastructure spending has to be funded more substantially
from the federal level. This reality is hard to conceive,
given that national debt has topped US$1 trillion and the
government had to bump up against its borrowing limit a
month earlier than expected.
The future for US cement manufacturers
This leaves cement manufactures with some confidence
in short-term opportunities only. In 2017, demand for
cement improved by 2.4% year-on-year, a marginally more
solid growth than the 1.7% growth of 2016, but below
the 3.4 and 8.0% year-on-year growth rates for 2015 and
2014, respectively. Were it not for residential construction,
2017 could have ended with a marginal 0 − 0.5% growth,
or even on the negative side. Hurricanes Harvey and
Irma, coupled with wildfires and an early on-set of
winter did little to deter growth, with demand in the
January − November 2017 period up 3.6% year-on year
(in Texas and some Southeastern states, demand fell
below historical levels in September).
The US Southeast and Pacific West regions saw the
largest CAGR growths in the 2012 − 2017 period, with
5.7% and 8.5% respectively. In contrast, demand in
the Northeast fell by 2% in the same period. The latter
region is also the one most in need of public funding
for infrastructure rehabilitation. Out of the top 10 states
that are most in need of reformation, eight states are in
the Northeast. However, that is not to say that the dire
situation of the region’s infrastructure will readily lead
to a boom in cement demand. The Northeast is likely to
be bypassed by the infrastructure investments, as critics
are quick to point out that investments will be focused in
Trump-friendly states in the South and Southeast.
Just like the country’s economy, growth in cement
consumption is steadily declining. If in the 2012 − 2017
period demand improved by 3%, the team at
CW Research forecast a below 3% CAGR growth for the
2017 − 2022 period, and below 2.5% growth in per capita
terms.
Net trade will see a much smoother growth compared
to the rapid acceleration observed in the 2012 − 2017
period. Imports will continue to be essential in meeting
demand, but CW analysts foresee domestic producers
improving their ability to keep up with the growth rate
of consumption. So far, only a handful of plants have yet
to convert from wet clinker production to dry. In 2017,
LafargeHolcim in Ravena, New York, and Oklahoma
completed two such conversions.
According to equipment suppliers to the US market,
there are quite a few mothballed operations across the
nation’s geographies. Even if demand were to grow, there
is no need for new integrated capacity (which is very
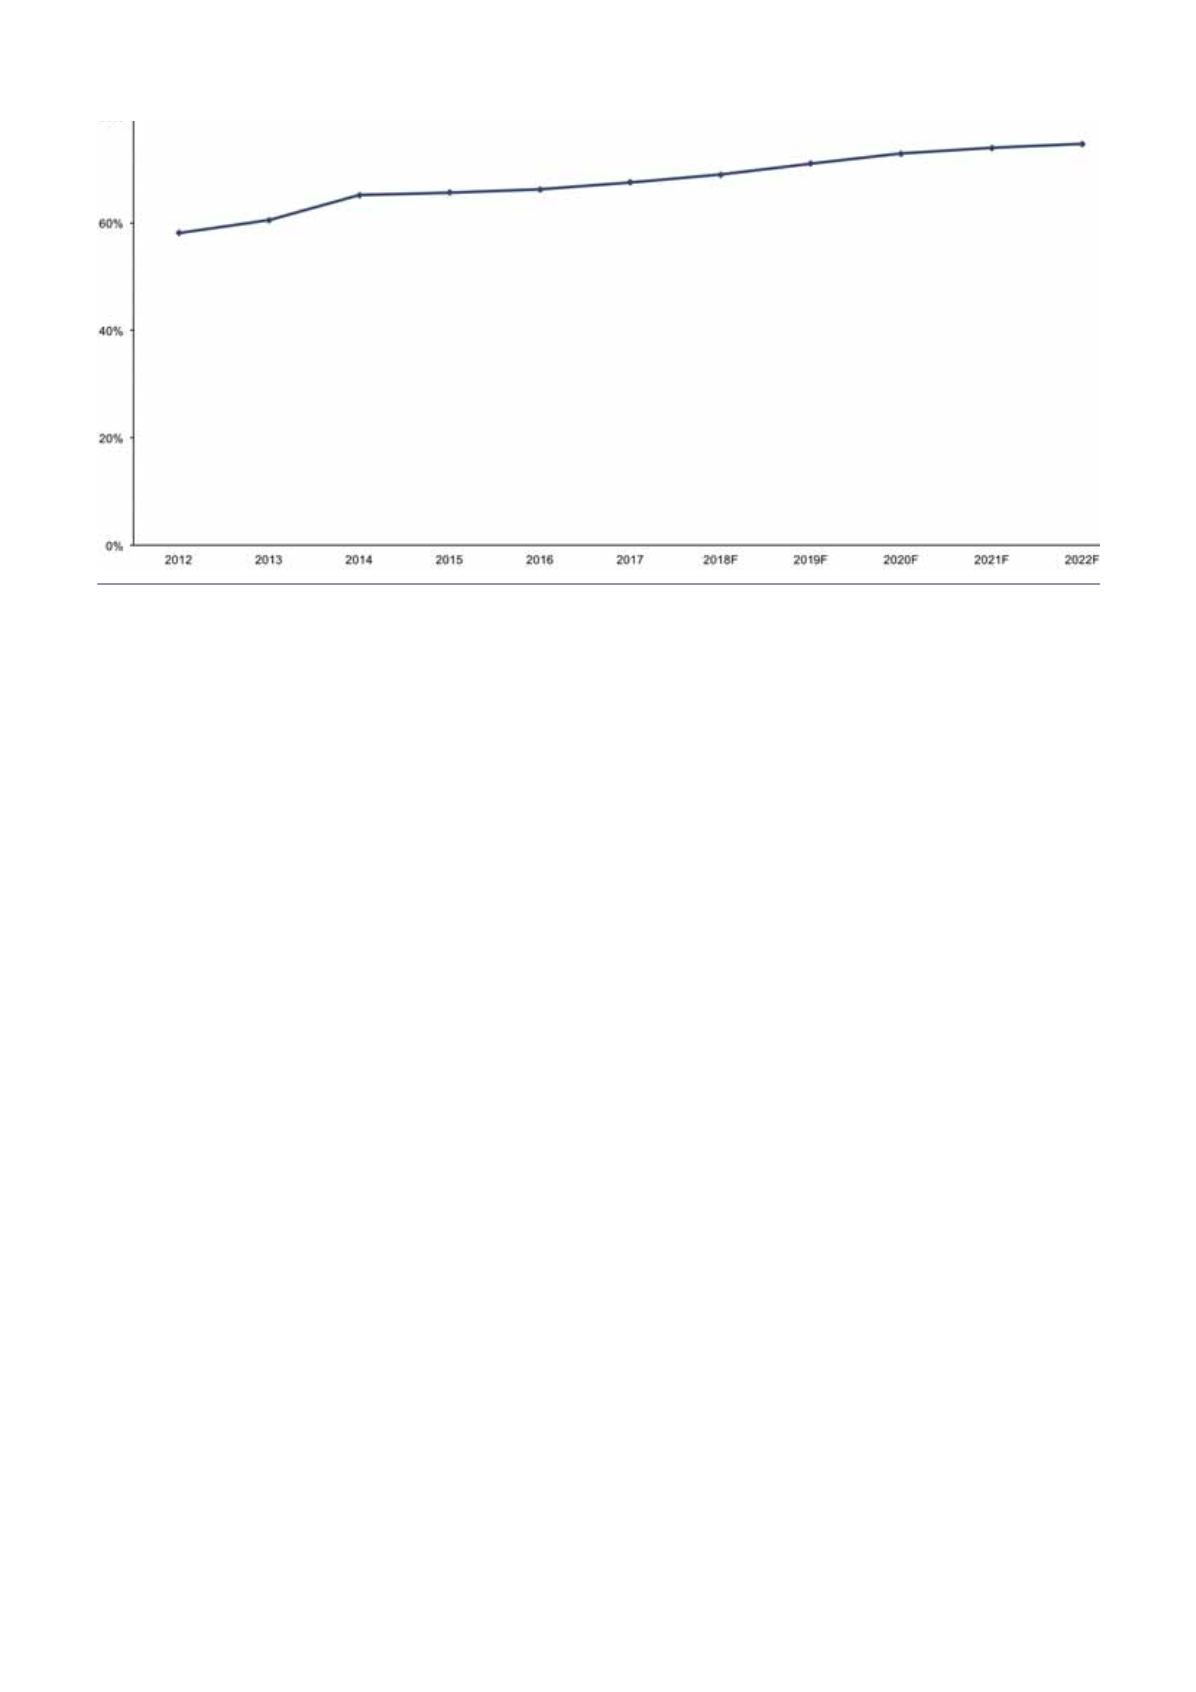
US cement utilisation rates (%).
Source: CW Research’s Global Cement Volume Forecast Report, 1H18.