


 70 / 140

November 2018
68 \
World Cement
Method
z
Statistically evaluate the dependent variables, given
by the SKF @ptitude analysis platform.
z
Identify the different stages of pre and post failure
by observing the changes in the correlation of the
variables.
z
Establish a reliable change pattern that allows early
identification of a change in the normal values
expected in the system.
Summary failure
z
The fault is declared on 14 March 2017 at 10:00 AM.
z
The acceleration trends coming from the
accelerometers located at points 13 and 14 entered
the alert zone 13 March 2017 at 3:00 PM and
11 March 2017 at 3:01 PM, respectively.
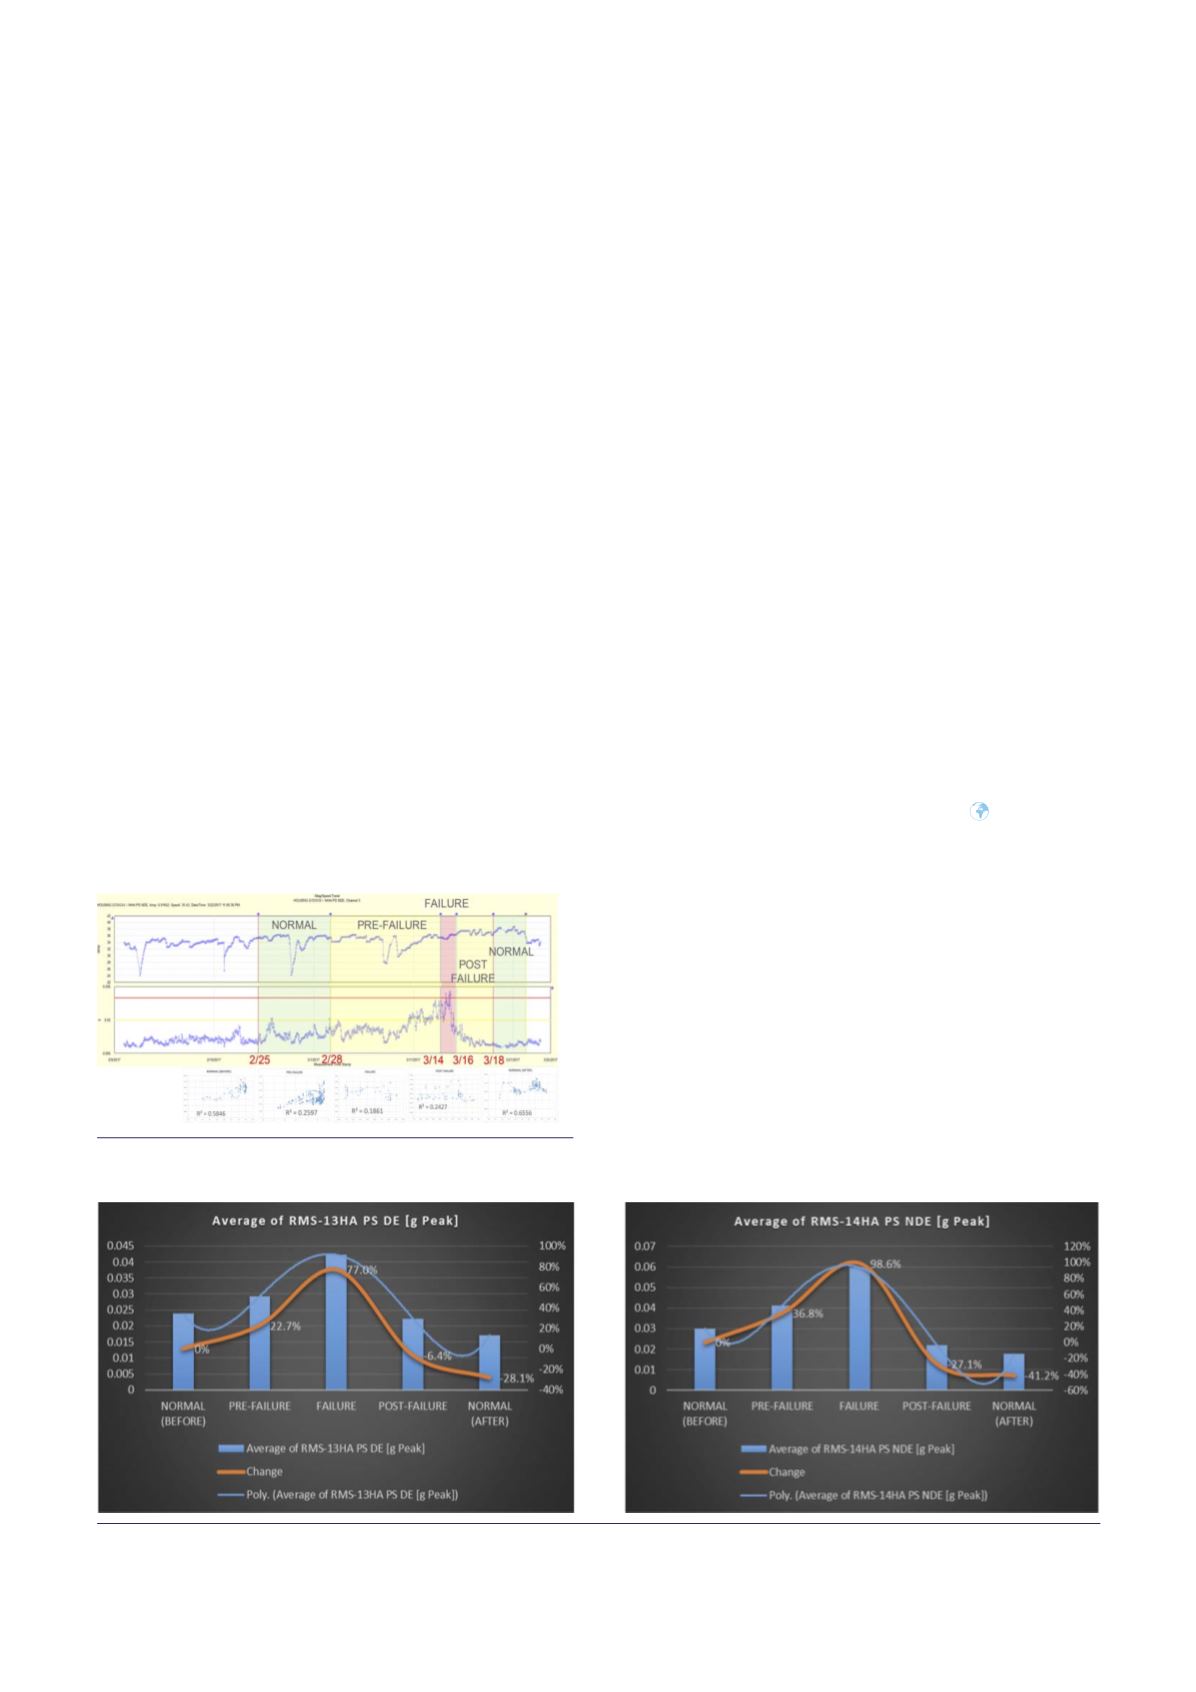
Comparison of energy levels
Based on the energy level of the initial normal period,
the percentage of increase or decrease of energy of the
other states is calculated. In both cases, the increase of the
energy released by the system in the phases of pre-failure
and failure is evident. An interesting point is the important
decrease of energy levels in the post and normal phases
after the failure; this decrease being around 30%.
Conclusion
It is possible to identify the correlations between the
relevant variables and define a point of inflection
of the trends. In this case, significant changes were
detected in 13 HA and 14 HA on 28 February 2017 and
27 February 2017, respectively.
Although the regression shows a clear change in the
mechanical condition of the equipment, it is necessary to
strengthen the model at higher confidence intervals.
SKF: next generation system
More and more online monitoring units are being
mounted onto clients assets, due to the value it provides
to their business. In the cases shown in this article, data
was analysed after it was collected (in other words,
after the process had finished). What should be done is
the automation of this analysis, through algorithms, to
obtain information related to an asset’s condition in real
time. To do this, machine learning instruments need to
be available that can make the mathematical evaluations
in real time.
One vital challenge to incorporate into machine
learning is the much needed computer security standard,
which sometimes makes it difficult to integrate systems.
However, by working with other teams, such as IT,
maintenance, operations, and process, it is possible
to overcome. Machine learning will enable real-time
analysis, meaning information will be received at the
right moment. This will benefit clients and also aid SKF
in staying on top of technological developments. SKF
is using its innovating technology and skills to improve
client’s rotating equipment performance.
Note
1. A crank is when there is an anomaly in the kiln shell
structure, causing the material inside to deviate from its
original rotary axis, evolving an eccentricity going down a
circular path.
About the author
Juan Pablo Ruiz is an Electronic Engineer who has been a
member of SKF’s team for nearly ten years. He is currently
based in Salt Lake City, Utah, and is globally responsible for
the Center of Excellence’s Condition Monitoring Projects. He
has more than 15 years of experience working in the area of
maintenance of industrial assets, specialising in technologies
for the monitoring of predictive conditions.
Figure 10. Determination of the evolution of the fault
for sensor 13.
Figure 11. Identification of the evolution of the fault by comparing energy levels.