


 68 / 140

November 2018
66 \
World Cement
a holistic vision of the asset’s condition. Variables
have always been analysed in the past; however, with
vibrational analysis data included, the client can make
more informed decisions.
Case study 1: Increase gear mesh frequency
–
output shaft gear box findings
Goals
z
To identify the main factors in the increment of
gear mesh frequency (GMF) output shaft gearbox
and the transitions to the bull gear’s housing.
z
Show the correlation analysis between mechanical
and process variables.
Observations: unbalancing power – correlation analysis
z
The surge of 67X into the gear bull is caused by the
GMF output shaft gearbox.
z
The increase of value of this frequency in the bull
gear (both housings) is consistent with the increase
of GMF output shaft gearbox.
z
The frequency is transmitted through the shaft.
z
With these observations, it is important to now
look for a cause of the increase of GMF (Point 12)
output shaft gearbox.
Conclusion
z
Increase of GMF output shaft gearbox (Point 12): a
potential relationship was detected but it was not
possible to confirmm as its repetitiveness has not
been proven.
z
Correlation signals (pressure) system anti-cranking:
1
it was possible to identify areas of operation of the
system, but it was not possible to correlate it with
vibrational increases.
z
Operational information analysis: it becomes
necessary to have a greater number of key
operational variables available, besides knowing
details of the operation of auxiliary systems, in
this case of anti-cranking. At the moment, the
analyses are limited and inconclusive. SKF has
been able to see a high potential in predicting
events detrimental to the equipment and
production.
Case study 2: Determination of pre- and
post-failure phases by means of dependent
variables
Goals
z
Identify an early start point of the fault that has
already occurred.
z
Show the potential of the correlation analysis
between mechanical and process variables by
identifying early signs of failure.
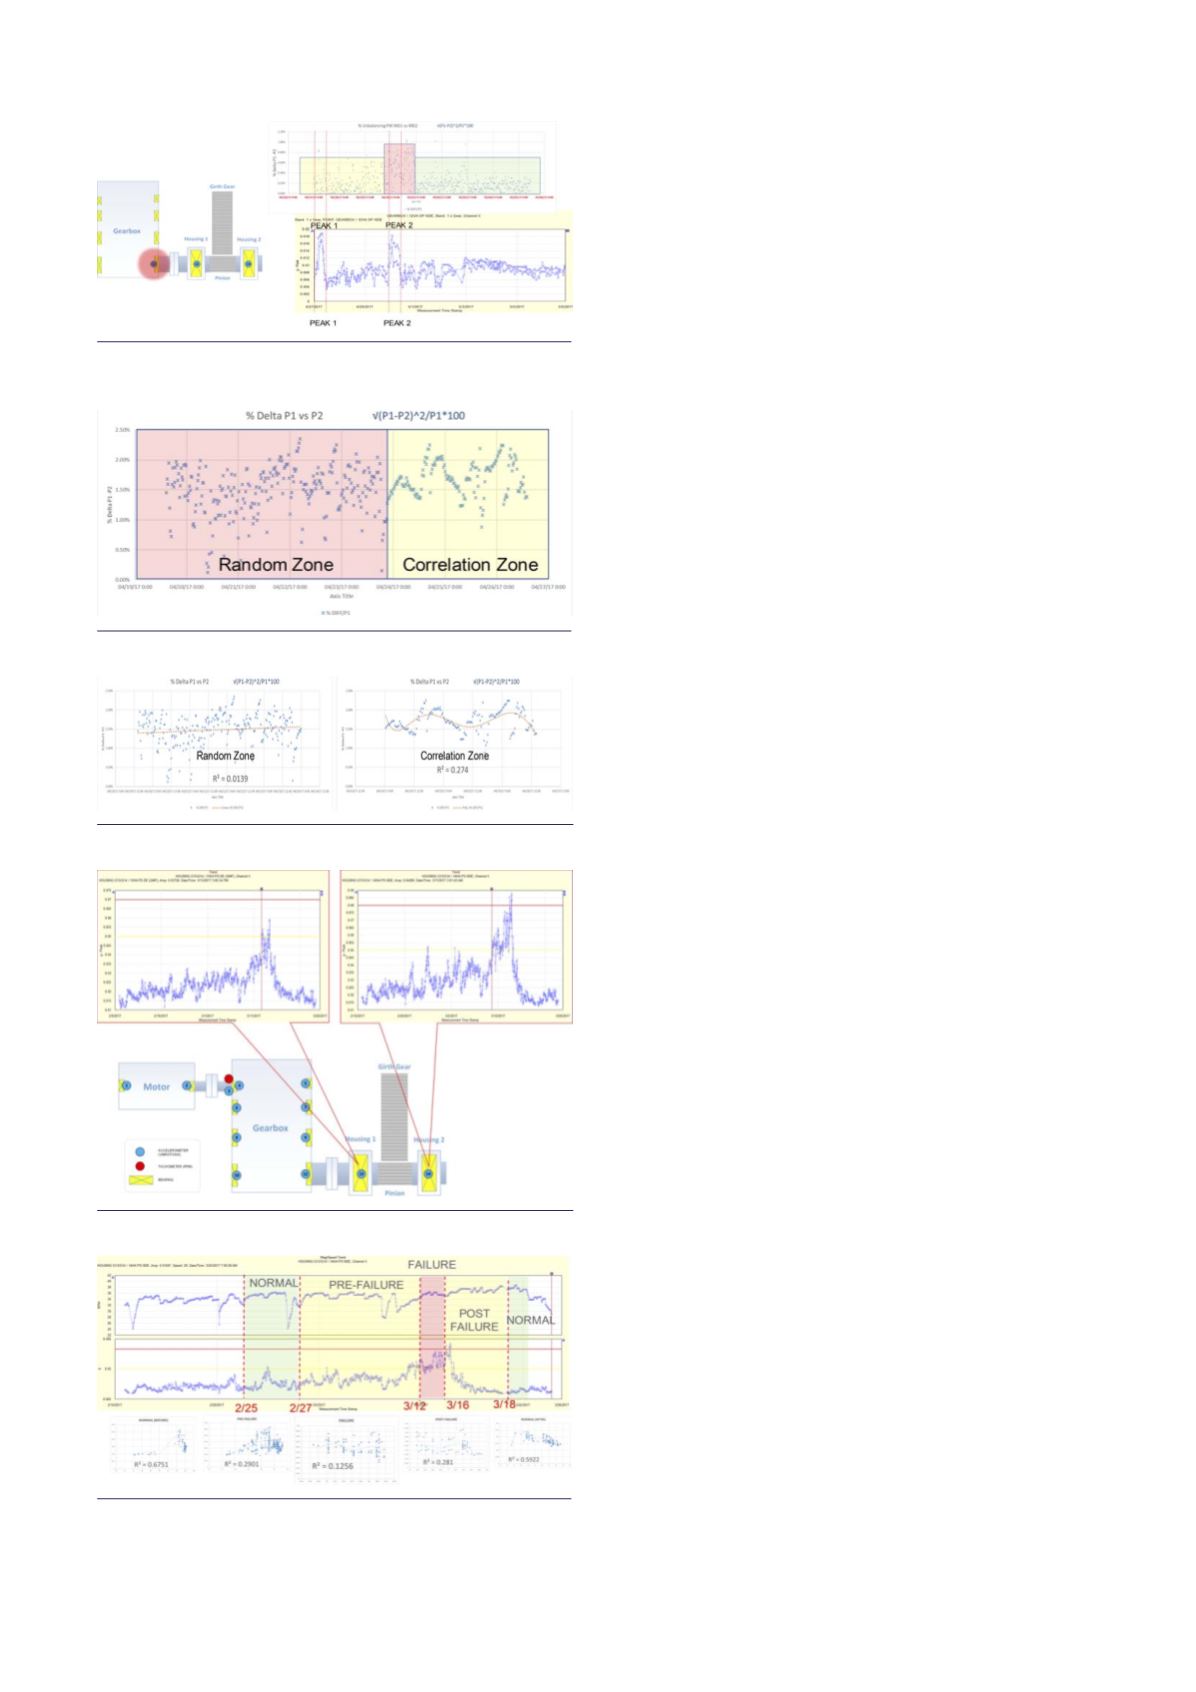
Figure 9. Determination of the evolution of the fault
for sensor 14.
Figure 6. Identification of correlation zones.
Figure 7. Determination of correlation for both zones.
Figure 8. Vibrational register of fault on sensors 13 and 14.
Figure 5. The crossover of unbalanced power and high
GMF frequency values on sensor 12 (red spot).