


 72 / 140

November 2018
70 \
World Cement
applications fail because the matching of the base
metal to the sensor metal is not good enough.
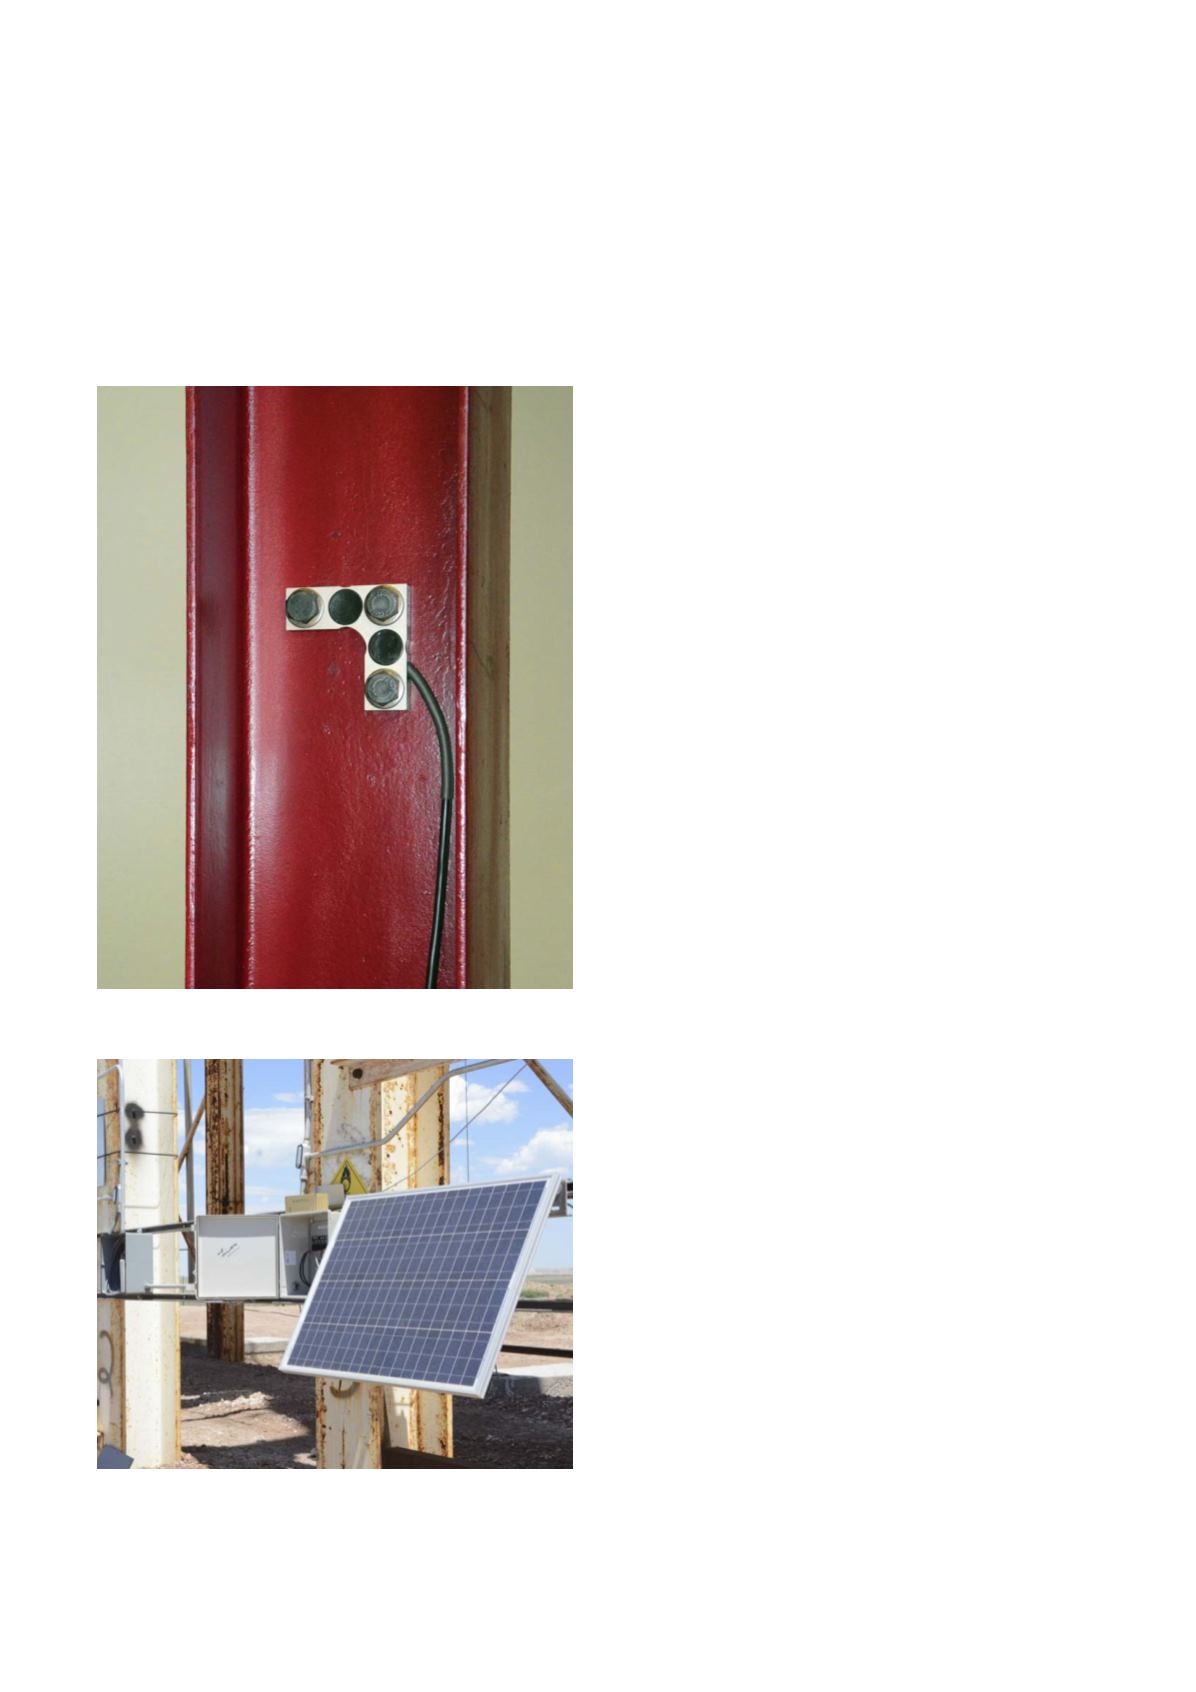
The latest ‘L-strain’ sensors eliminate this
problem. They mimic the original strain-gauge
installation, which had both vertical strain gauges
to measure the stress due to the vessel weight and
horizontal gauges to compensate for the expansion
of the base metal (Figure 1). These sensors are
insensitive to thermal expansion and give much
better performance on steel structures. They can
even be used on aluminium and stainless steel
structures. Since the vessel legs and structure twist
and warp when sunlight heats their elements, the
sensor should be mounted on the neutral axis of
the columns. It can be bolted tightly onto the leg
or, in the case of round or O-section legs, bolted to
‘weld tabs’, which are round steel pucks with holes
pre-threaded, welded onto the leg. On skirted silos,
the sensors are bolted onto the inside surface of the
skirt, using rounded washers to compensate for the
slightly curved base metal.
Up to eight sensors are then connected to a
digital transmitter (one for each vessel). These digital
transmitters are wired in multi-drop or ‘daisy chain’
fashion to the data acquisition unit, which has either
a touch-screen or a PC computer as display device.
Since the transmission is digital, only a single cable is
required and it can be run long distances without any
loss of accuracy. Alternatively, a digital one-to-one
or one-to-many radio link can be used in a network
where it is inconvenient to run wiring, or where
distances of one or more kilometres are necessary.
In network mode, the radios connect to each other
in the way that gives the strongest signals between
each pair and they can repeat, if necessary, to cover
long distances or bypass an obstacle in the path. The
vessel group can be solar powered when power is
not available, as is the case at many silos for blasting
supplies in mines and quarries (Figure 2).
Touchscreen display
The touchscreen display shows up to six vessels as
bar graph displays on the home screen. This bar
graph is green in the normal working region but
changes colour as alarm points are reached, giving
operators a quick visual picture of all their vessels at
a glance. Tapping one of the bar graphs switches the
view to a trend graph of the chosen vessel, showing
the last 24 hours of activity. This can be zoomed
from 2 hours to 14 days and results can be saved on
a USB drive. The many features of the touchscreen
display include analogue and digital input/output
(I/O), user-friendly setup and calibration menus,
sensor and transmitter diagnostics, multiple
languages, and network connection. This allows the
display to be viewed on another computer, local
phones, and tablet computers connected to WiFi,
using viewing application software. One special
feature is delivery measurement: by zooming to the
time and date of each delivery, then tapping before
and after the delivery, the difference in weight is
displayed, enabling detection of delivery shortages.
Some vessels are mounted on a shared frame
holding two or three vessels without legs. Sensing
the load on each pair of frame legs, the sensor
uses a built-in formula to calculate the load in each
vessel. Likewise, divided silos (silos with a partition
separating two sections) can be measured and
displayed as separate vessels.
Figure 1. A L-Strain sensor installed on an H-section
support column.
Figure 2. A solar power installation for a four silo
group holding blasting supplies at a large coal mine in
Wyoming, US.