


 24 / 84

North America 2018
22 \
World Cement
(Table 2). The location of the gas extraction, at the
discharge of the main baghouse fan, ensured that the
capture had no impact on the kiln operations.
CO
2
capture
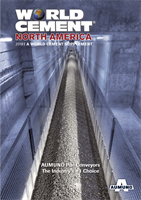
The cryogenic capture technology was installed at
the Argos cement plant in Roberta (Figure 1). The
technology was contained within shipping containers.
SES operated a skid-scale External Cooling Loop
Cryogenic Carbon Capture (ECL CCC) process unit. This
unit has previously processed flue gas from power
plants, heating plants, and cement kilns with flue gas
CO
2
concentrations ranging from 5
–
22% and from
combustion sources, including natural gas, bituminous
coal, sub-bituminous coal, biomass, municipal waste,
and shredded tyres.
A slipstream of flue gas was collected from a
location on the discharge side of the main baghouse
fan before the stack. A total of 50 SCFM was diverted
to the capture system. The flue gas was cooled by an
internal cooling system. The cryogenic capture approach
is robust in the face of changing CO
2
composition and
during these tests the CO
2
concentration fluctuated
between 11 − 13% as the raw mill was put into and
taken out of service. The CO
2
capture rate averaged
around 97.5%.
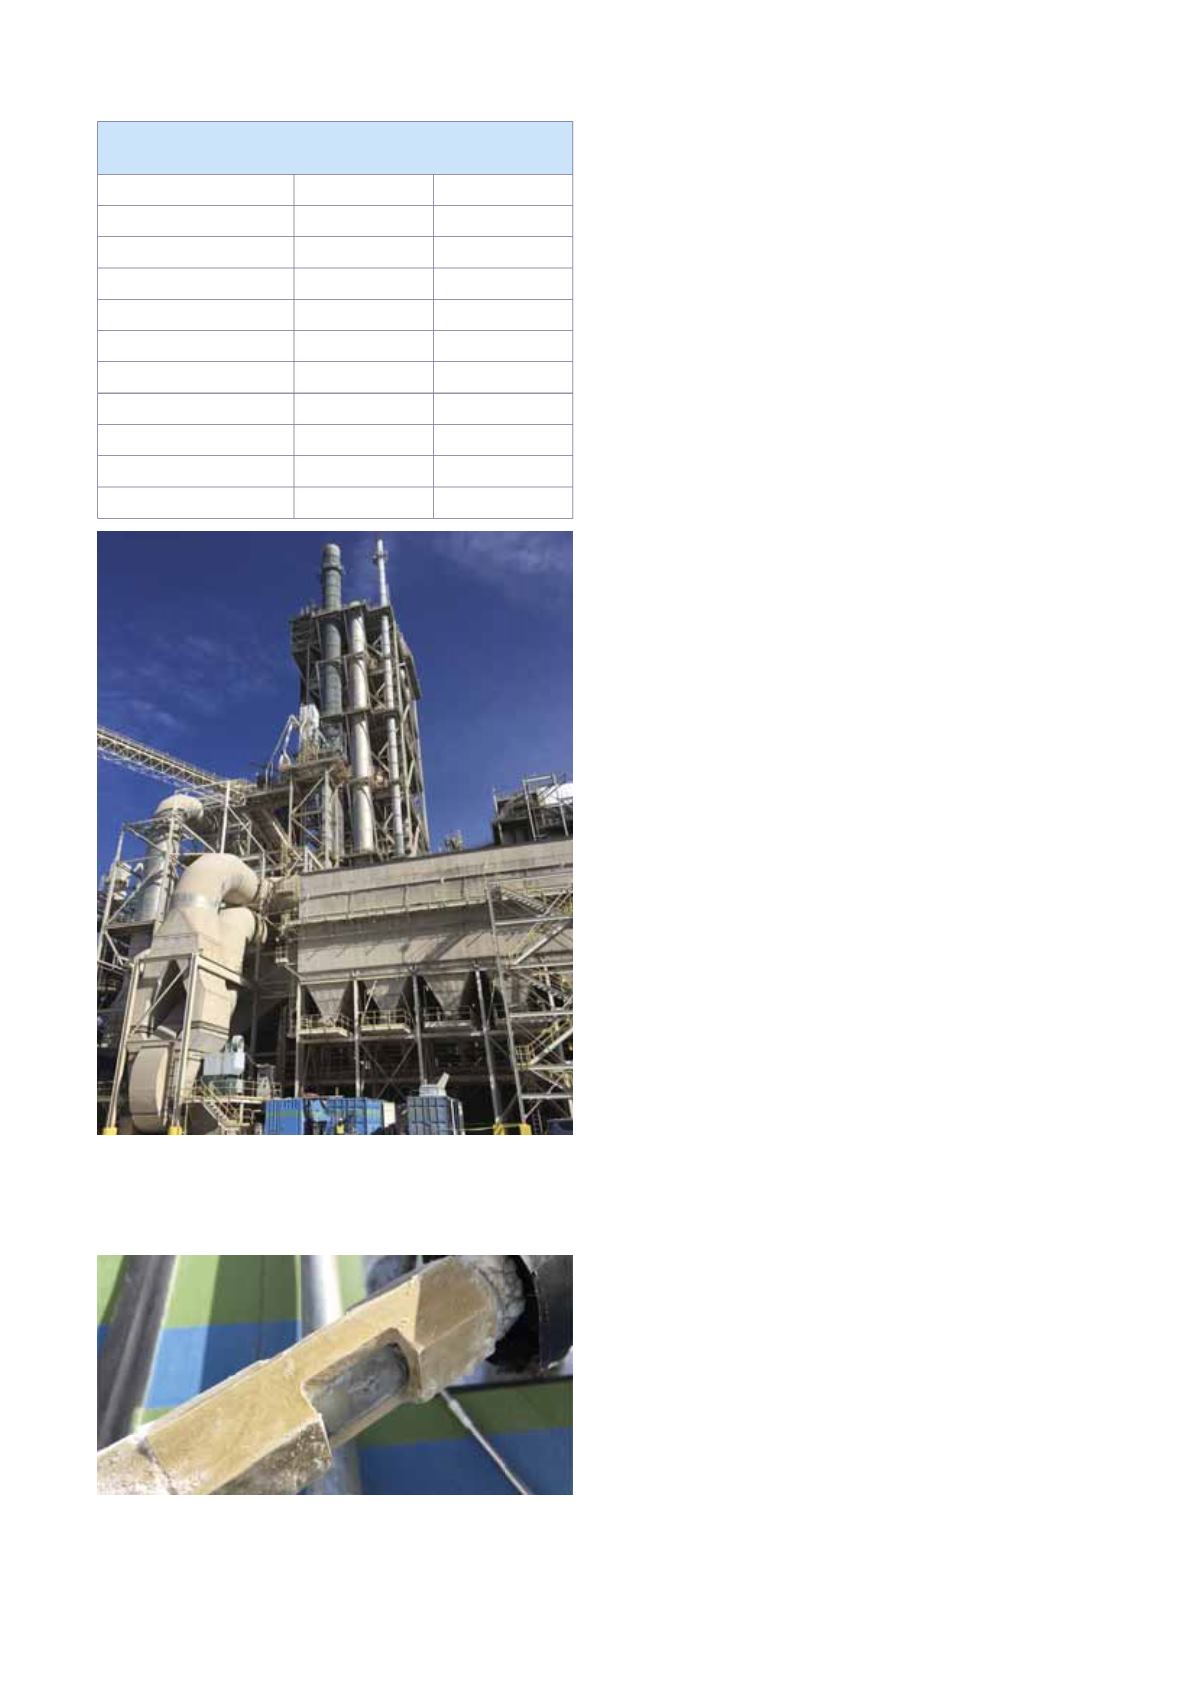
Figure 2 shows liquid CO
2
through a glass viewing
port just before it filled a CO
2
dewar (liquid CO
2
storage
tank). A white circular object at the left of viewing area
is a nylon ball used to indicate that CO
2
was flowing
when the viewing window became full of liquid.
The technology captured a total of 440 kg of liquid
CO
2
in three dewars. The captured CO
2
was over 99%
pure. The dewars were transported by a truck from
Calera, Alabama, to the concrete plant in Atlanta,
Georgia (Figure 3).
CO
2
utilisation
The captured CO
2
was connected to the CarbonCure
ready-mix system at the Argos Glenwood plant
(Figure 4). The CO
2
was injected into batches of concrete
delivered to a US$80 million mixed-use development
under construction in downtown Atlanta. A proportion
of the CO
2
was mineralised into the concrete. One day
of production saw 30 loads utilise 67 kg of CO
2
in 220
m
3
of concrete.
Next steps
The scaling-up of the cryogenic capture approach
promises to realise both economic and efficiency
gains. Commercial-scale implementation of the
cryogenic capture approach could reach a 100 tpd
output at half the cost, while having an advantage in
retrofit scenarios. The implementation could produce
high-purity liquid CO
2
for less than US$100/t, requiring
only a 230 m
2
footprint, along with electrical and water
hookups to the plant. Scaling up the capture would
drive costs much lower. Should the integrated capture
produce CO
2
in excess of the immediate utilisation
Figure 1. SES technology installed at the Roberta
cement plant. The technology was contained in the
two left shipping containers, while the third was for
transport purposes only.
Figure 2. Flow of liquid CO
2
as observed through a
viewing window.
Table 2.
Average plant operating data during the
CO
2
capture trial.
Factor
Unit
Value
Flow
acfm
518 984
Clinker output rate
tph
168
CO
2
%
11.5
CO
2
emission rate
tph
131.8
H
2
O
%
10.4
NO
X
PPM
89.5
NO
X
mass rate
tph
0.106
O
2
wet
%
12.2
SO
2
ppm
1.6
SO
2
mass rate
tph
0.003