


 18 / 60

16
World Cement
North America 2019
to spend more on infrastructure. This segment,
while strong, is facing competition from health
and pension costs for public workers. In
some cities, the unfunded plans will be large
enough to bankrupt the area. If states could go
bankrupt, the US would add a few. With a new
Congress, there is an increased probability of
more federal money for infrastructure projects
(even though its chances of passage remain
below 50%). Overall, the outlook remains
good, with excellent pricing power and modest
volume growth.
State by state outlook (Figure 11) shows
modest gains for most states. North Carolina,
a strong growth state, is unusual because
SCMA shows a decline over five years – the
explanation is a very high starting point in 2018
and 2019. Most of the Northeast and much
of the Midwest will be down as out-migration
accelerates towards the warmer states.
Because SCMA believes oil prices will remain
in the US$45 to US$65 range, the Southern,
lower energy drilling cost states do well.
US cement supply outlook: 2019 to
2024
An integrated North American market
The 2020 − 2024 US supply outlook
encompasses all currently operating US
portland cement manufacturing locations,
as well as those facilities located in Canada
and Mexico that are permanent or ‘structural’
elements in the US supply equation.
z
z
Virtually all Canadian portland cement
manufacturers operate permanent facilities
in the US and product flows seamlessly
into neighbouring US market areas.
z
z
The newest cement manufacturing location
in North America, the McInnis plant
in Port Daniel, Quebec, supplies two
large, state-of-the-art marine terminals in
Providence, Rhode Island and New York,
New York.
z
z
Mexican producers GCC and CEMEX,
which both have extensive US-based
operations, regularly distribute cement
from Mexico in Texas and, less frequently,
Arizona.
Methodology and assumptions
Nameplate capacity
The starting point for the analysis is the
calculation of ‘nameplate capacity’ for all
plants serving US customers. Daily clinker
capacity (tpd) is used as reported by the
Portland Cement Association, multiplied by
330 days, and then multiplied by 1.05 for
gypsum additions. Clinker grinding capacity is
not explicitly considered in this analysis.
Clinker factor and supplementary cementitious
materials
The practice of adding ground limestone to
ground clinker to effectively increase cement
capacity is well established in Canadian
markets and should become a more common
practice in US markets in coming years. This
can lower producers’ costs/tonne of finished
cement, as well as lower the CO
2
footprint
of the finished product. Because of the
uncertainty surrounding the adoption of this
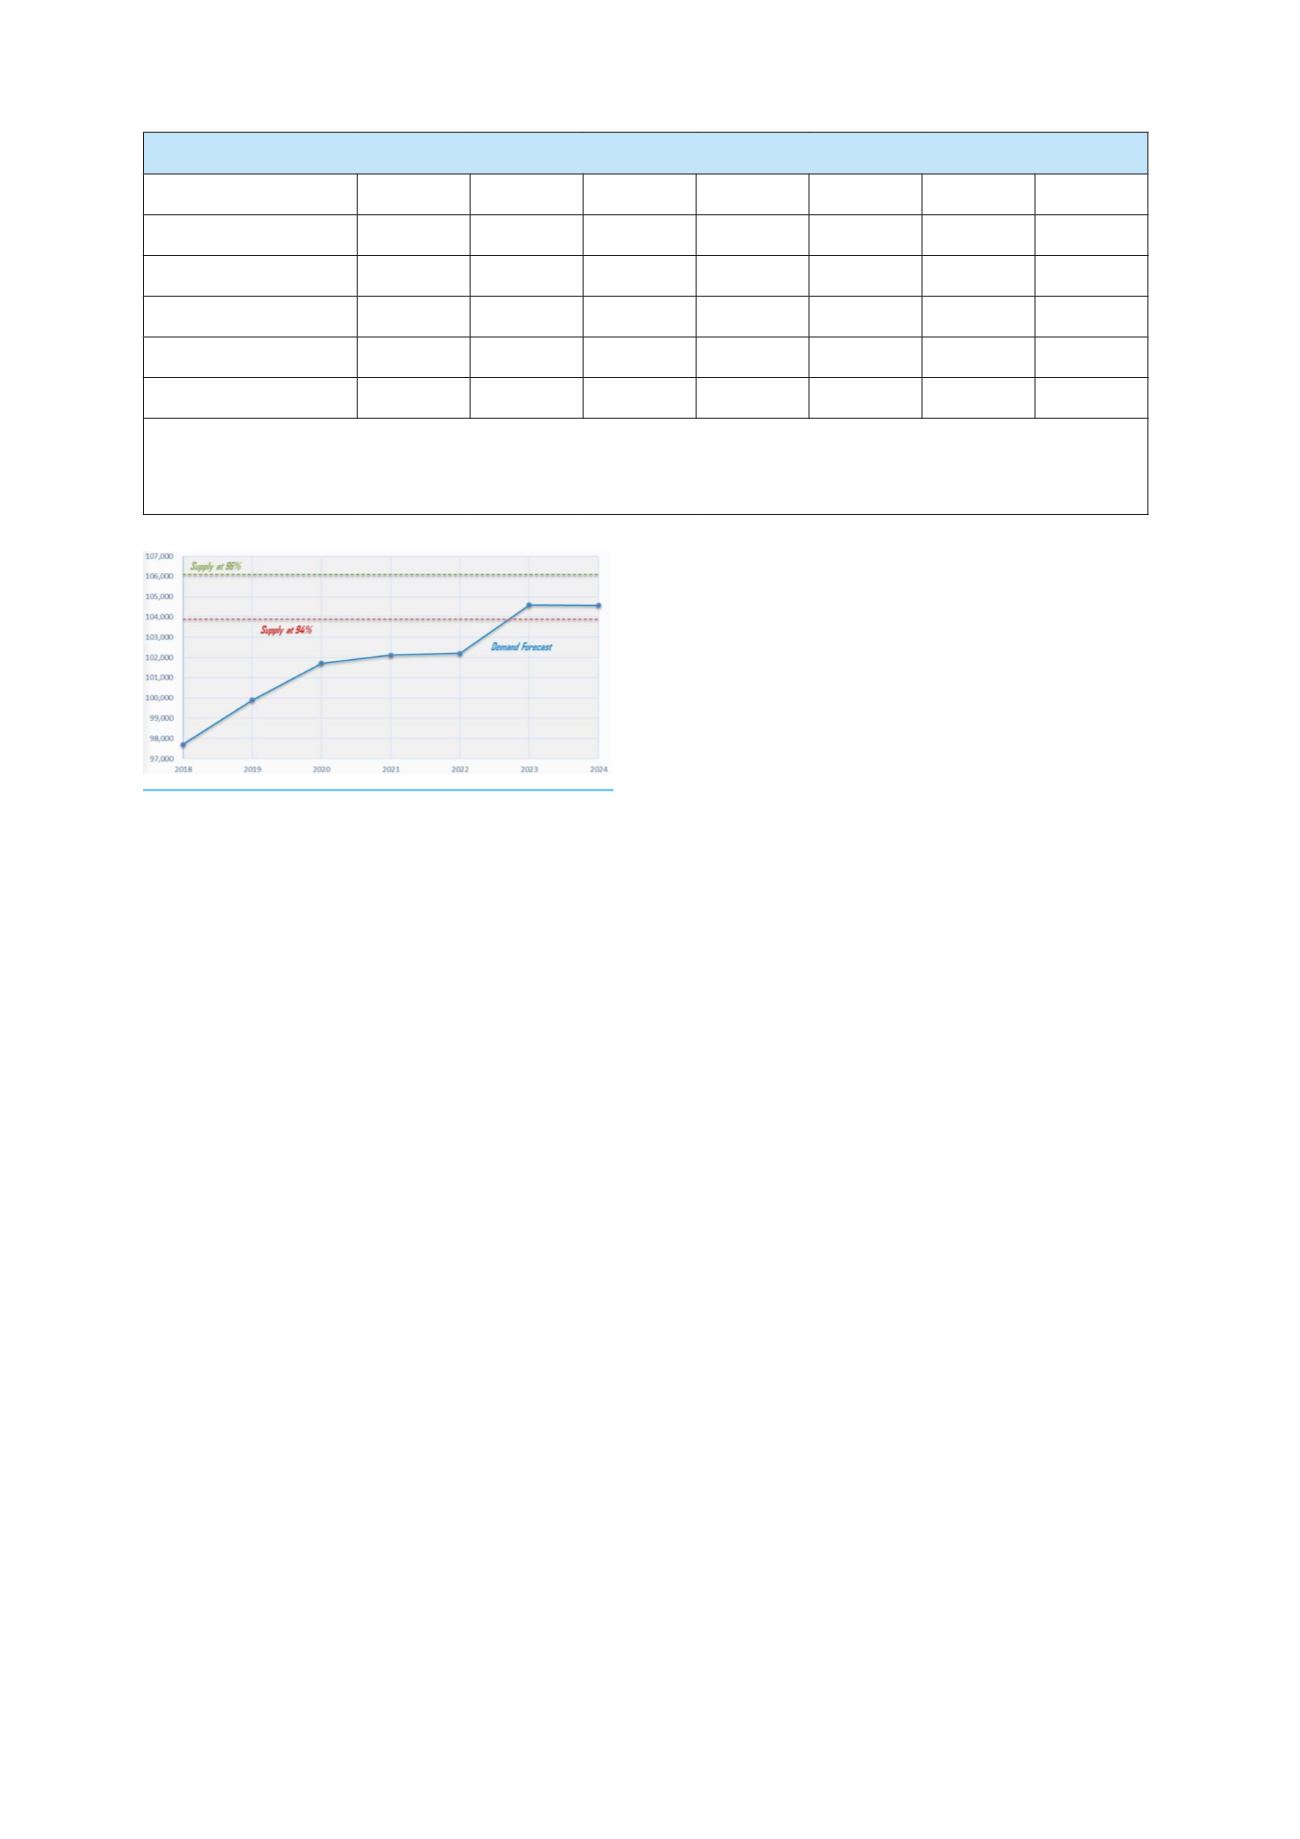
Figure 12. US portland cement supply vs
demand.
Table 1. Cement demand: baseline (million t).
2018
2019
2020
2021
2022
2023
2024
Residential
25.9
27.3
26.9
27.6
28.8
30.3
30.3
Non-residential
29.6
29.6
29.3
29.5
29.0
29.2
28.8
Non-building
42.1
43.1
45.6
45.0
44.3
45.1
45.5
Total
97.6
100
101.8
102.1
102.1
104.6
104.6
Year-on-year change (%)
+3.6
+2.5
+1.8
+0.3
+0.0
+2.4
0.0
Note: SCMA’s definition of cement is portland and blended in tonnes.
Note: There is a small difference between SCMA’s estimates of consumption and the USGS because of SCMA’s own estimates in
states where USGS does not report values due to competitive concerns.