


 14 / 60

12
World Cement
North America 2019
SCMA, the debt to GDP ratio will continue
to increase somewhat. This means the US
will never pay down its National Debt. This is
not an intractable problem as long as interest
rates remain low. The outlook is for low
interest rates (a 10 year treasury rate below
4%) to continue. This means a debt crisis will
be avoided for the next five years at least.
With the current tax environment and
policies, GDP growth should be able to grow
by near 3%/year for the next four years.
This is very unusual. It has been growing for
nine years, and adding another five without a
recession is rare. Still, the power of incentives
is underappreciated. For now, the incentives
for investment and innovation are high and will
result in continued rapid capital investments
(both physical and intellectual). There are
dozens of things that could stop this growth
path, but none are high enough to forecast a
low GDP path through to 2024.
Economic background summary
z
z
Population growth is slowing and will
average near 0.5% year-on-year for the
next five years.
z
z
Migration patterns will favour the Sunbelt
and Mountain regions.
z
z
State tax differentials will become even
more important for location decisions.
z
z
GDP growth will average nearly
3%/year through to 2024 (if policies do
not change).
Construction materials drivers
With solid economic growth likely to
continue, conditions are favourable for higher
construction spending through to 2024.
Among the three major segments, however,
only infrastructure spending will move much
higher.
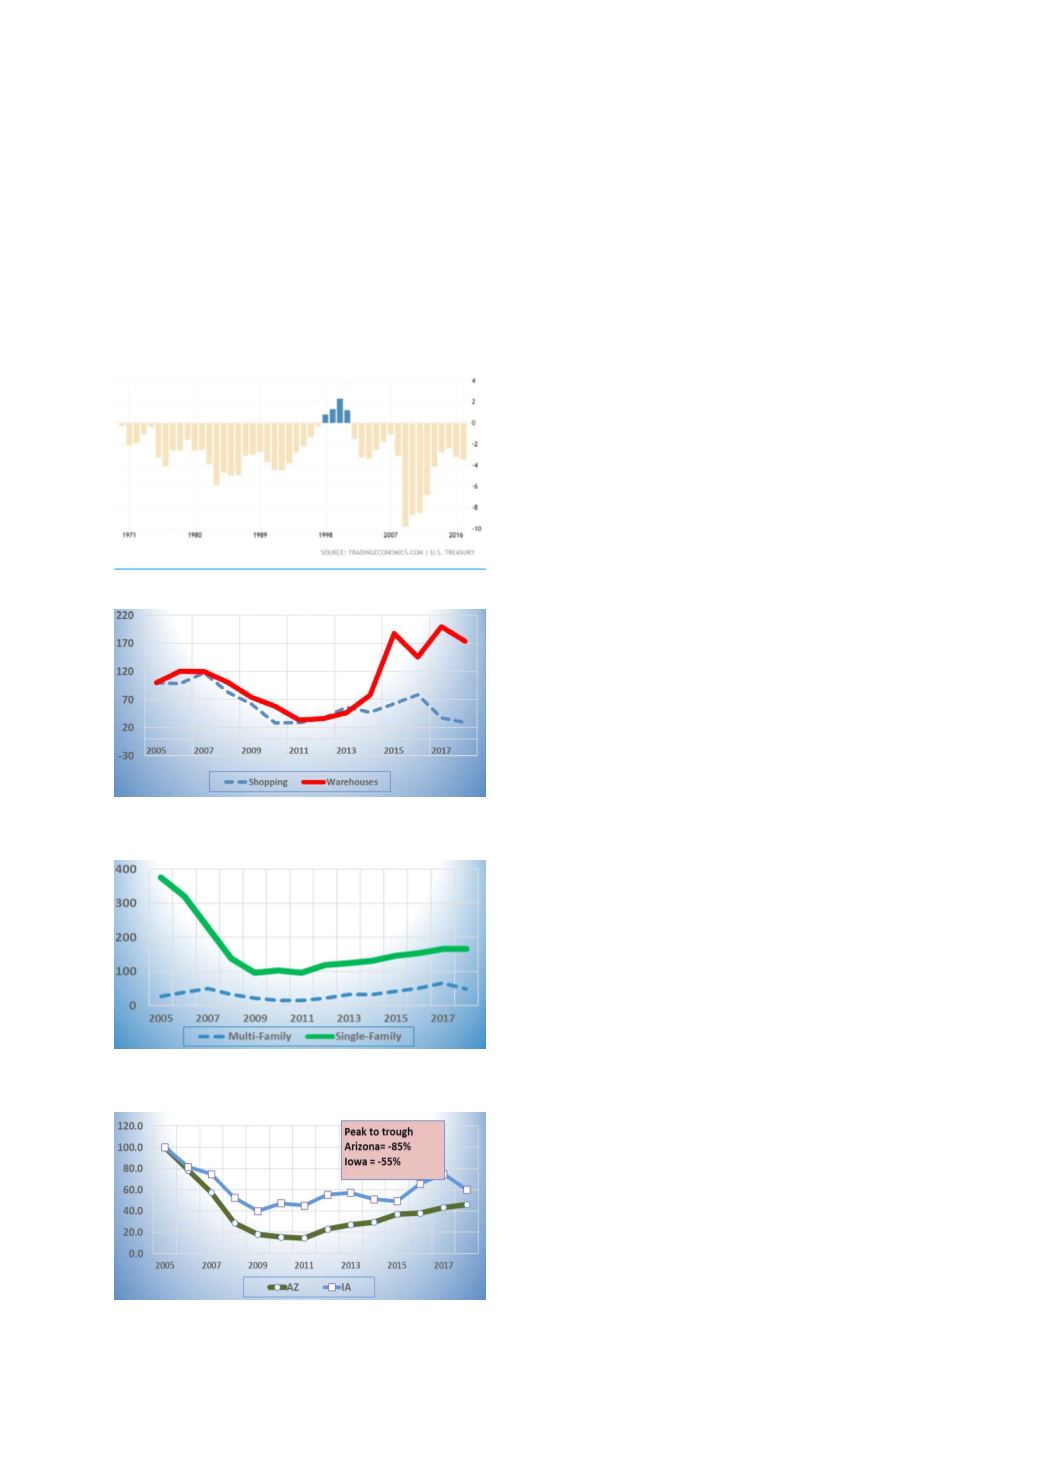
In the non-residential segment, the US
is in a ‘retail ice age’ (a term coined by
analyst Burt Flickinger). Figure 6 shows the
dramatic switch from retail to warehousing:
another impact of the Amazon effect. While
the structural shift is not over, it should be
complete before 2024. This, along with
modest employment growth (the US is already
at full employment), will result in little growth
for non‑residential construction spending
during most of the next five years.
The biggest changes in construction
come from residential, due to its sensitivity
to a variety of factors, but most importantly
to mortgage rates. Within residential, it is
single‑family buildings and suburban areas that
usually have the largest swings.
In addition to the wider variability of
single‑family to multi-family buildings, among
the states there is also a much wider variability
over time. The high flyers (Arizona, California,
Florida, and Nevada) usually have the biggest
drops during a downturn and the biggest
spikes upward during a recovery (Figure 8).
This is one of the reasons SCMA forecasts all
construction materials at the county level: to
capture these nuances. In this way, the roll-up
to metro, state, or national should be more
realistic.
Figure 5. US federal budget defecit to GDP (%).
Figure 6. Warehousing vs retail (2005 to 2018
ft
2
,
indexed 2005 = 100).
Figure 7. Residential building (2005 to 2018,
million ft
2
).
Figure 8. Housing starts (2005 to 2018,
indexed 2005 = 100).