BMHR 2016
44 \
World Cement
access roads along the conveyor. Then, the best location
is determined for the drives and belt take-up, denoting
a good conveyor design that will operate properly under
starting, stopping and running conditions. This is the
initial point, and an adequate definition and sizing of the
equipment will further determine the best cost-effective
and proper operation of the equipment.
The routing of the belt conveyors can always be
adapted and accommodated to the geographic and
topographic conditions by combining horizontal and
vertical curves.
Conveyor dynamic analysis
Today, the most powerful tools available can be used to
design the conveyor systems and computerised dynamic
analysis modelling can be applied. Dynamic analysis
modelling is the method that analyses a belt as an
elastic system with a real-time dynamic response. The
belt is modelled as a series of connected elastic springs
with individual masses and damping properties. This
technique has been developed to predict the creation and
propagation of tension and velocity waves in conveyor
belts during transient operations. Once the static design
has been completed, it is recommended that a dynamic
analysis be carried out to determine any possible starting
and braking problems that can occur.
Booster drives on the conveyor’s material carry side
Intermediate drive technology is well accepted and
widely used in underground coal mining. Many mines
and cement plants around the world have incorporated
it into their current and future mine plans to increase the
efficiency of their overall mining operations.
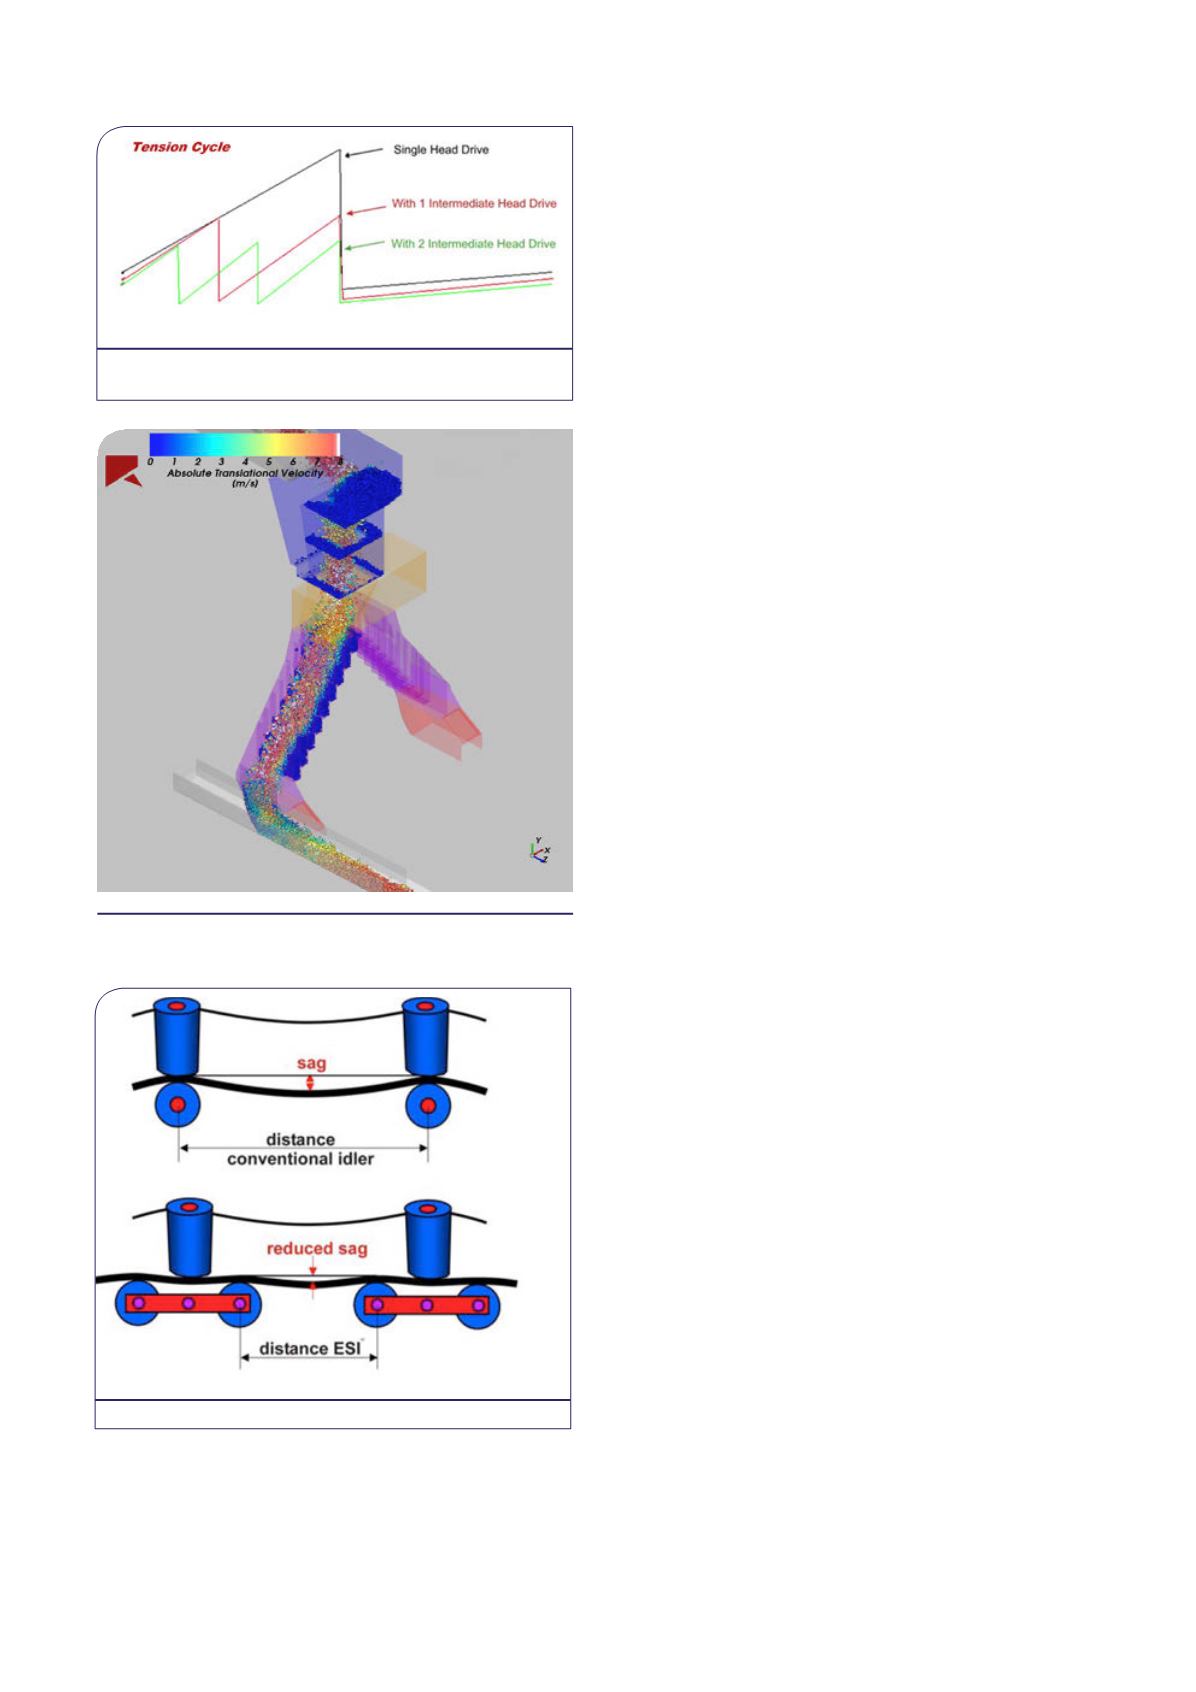
The tension diagram (Figure 1) shows the simple
principle and the most significant benefit of intermediate
belt conveyor drives. A flat, head-driven conveyor has
a simple belt tension distribution, as shown in black.
Although the average belt tension during each cycle is only
about 40% of the peak value, all belting must be sized for
the maximum value. The large drop in the black line at the
head pulley represents the total torque or power required
to run the conveyor. By splitting the power into two
locations (red line), the maximum belt tension is reduced
by almost 40%, while the total power requirement remains
virtually unchanged. A much smaller belt can be selected
and also smaller individual power units can be used. To
extend the example further, a second intermediate drive is
added (green line), and the peak belt tension drops further.
However, the benefit is reduced as the maximum tension
is only reduced by 25%. Moreover, each additional drive
produces exponentially decreasing benefits.
Simulation conveyor transfer chute
A proper design of the conveyor transfer chutes is an
important task. Therefore, it is essential to investigate
the operational behaviour of the discharge material flow
using the discrete element method or ‘DEM’ (Figure 2).
Modelling a granular flow simulation using DEM is one of
the most significant scientific advances in mining. Cohesive
material properties have been included in the model to be
able to capture any stick or slip behavior.
Chute geometry optimisation can be done using
ROCKY Discrete Element Modeling DEM software.
Figure 2. Flow material discharge simulation using
ROCKY Discrete Element Modelling Software.
Figure 1. Belt tensions influenced by booster drive
installations (
Rights from Overland Inc. Co
.).
Figure 3. Energy saving idler.


