


 38 / 140

November 2018
36 \
World Cement
optimising all of the potential benefits consequent
of AF substitution. This depends on the successful
management of several project stages encompassing:
AF availability, their quality, calciner configuration,
feeding points, and emissions, as well as considering
the potential return on investment of the associated
equipment updates.
The traditional AF firing approach starts with a
small-scale AF feeding assembly and builds on that
after initially and successfully managing a TSR of
between 15% – 25%. Nowadays, however, there
is an increasing trend toward the use of advanced
analytical tools, as experience has demonstrated the
clear advantages of such tools in securing long-term
financial gains. An increasing number of plants are
effecting detailed analyses during the early stages of
AF substitution, from AF procurement possibilities,
feeding equipment choices, and process calculations,
to mineral interactive computational fluid dynamics
(MI-CFD) optimisation, wherein combustion,
calcination, emissions, pressure losses, and build-ups
are simultaneously calculated and the
economical/technical benefits are clearly quantified.
In this respect, this article is aimed at highlighting
some of the challenges of substituting 100% AF in
calciners.
Table 1 gives a summary of some recent AF
projects, using detailed process, combustion, and
emission analyses with the aid of MI-CFD. Typical
operational values of the plants are shown before
optimisation. In plants where the TSR was quite
low, the aim of the optimisation was to increase the
TSR. However, in plants that had already achieved
close to 100% TSR, the aim of the optimisation was
to resolve process and emissions issues (such as hot
spots and higher CO/NO
X
emissions). This required
calculation of all the influencing and interacting
variables, alongside adjustments to, for example,
burner locations, angles, and momenta, as well the
split/relocation of the meal inlets.
Table 1.
Some recent Cinar projects on AF use in various types of calciner.
Type
Production
(tpd)
Primary
fuel
TSR (%) AFR
Residence
time (sec.)
Calc/ion
(%)
CO
(ppmv)
NO
X
(ppmv)
RSP
2900
Petcoke 50
Shredded
tyres
4.5
92
na
na
IKN
2400 – 2700 Petcoke 80 – 100 Coarse RDF >8
90
500
600
KHD Pyroclon 2300 – 2400 Coal
80 – 100 RDF
8
98
2500
700
Air Through 1900
Coal
100
Tyre chips
2
65
1600
780
Sinoma
6100 – 7000 Coal/
petcoke
8
Sewage
sludge
>8
98
na
na
RSP Minnox
3100
Coal/
petcoke
50
MSW 4
90
6050
770
FLSmidth ILC
Coal/
petcoke
37
Corn, ASF 3
96-97
na
600
KHD
8000
Coal
40
Biomass
5 – 6
95-96
460
300
HotDisc
3500
Coal
80
Various* 8.5
97
140
na
*Asphalt shingles (2%), wood chips (38%), dry material (20%), and shredded tyres (20%).
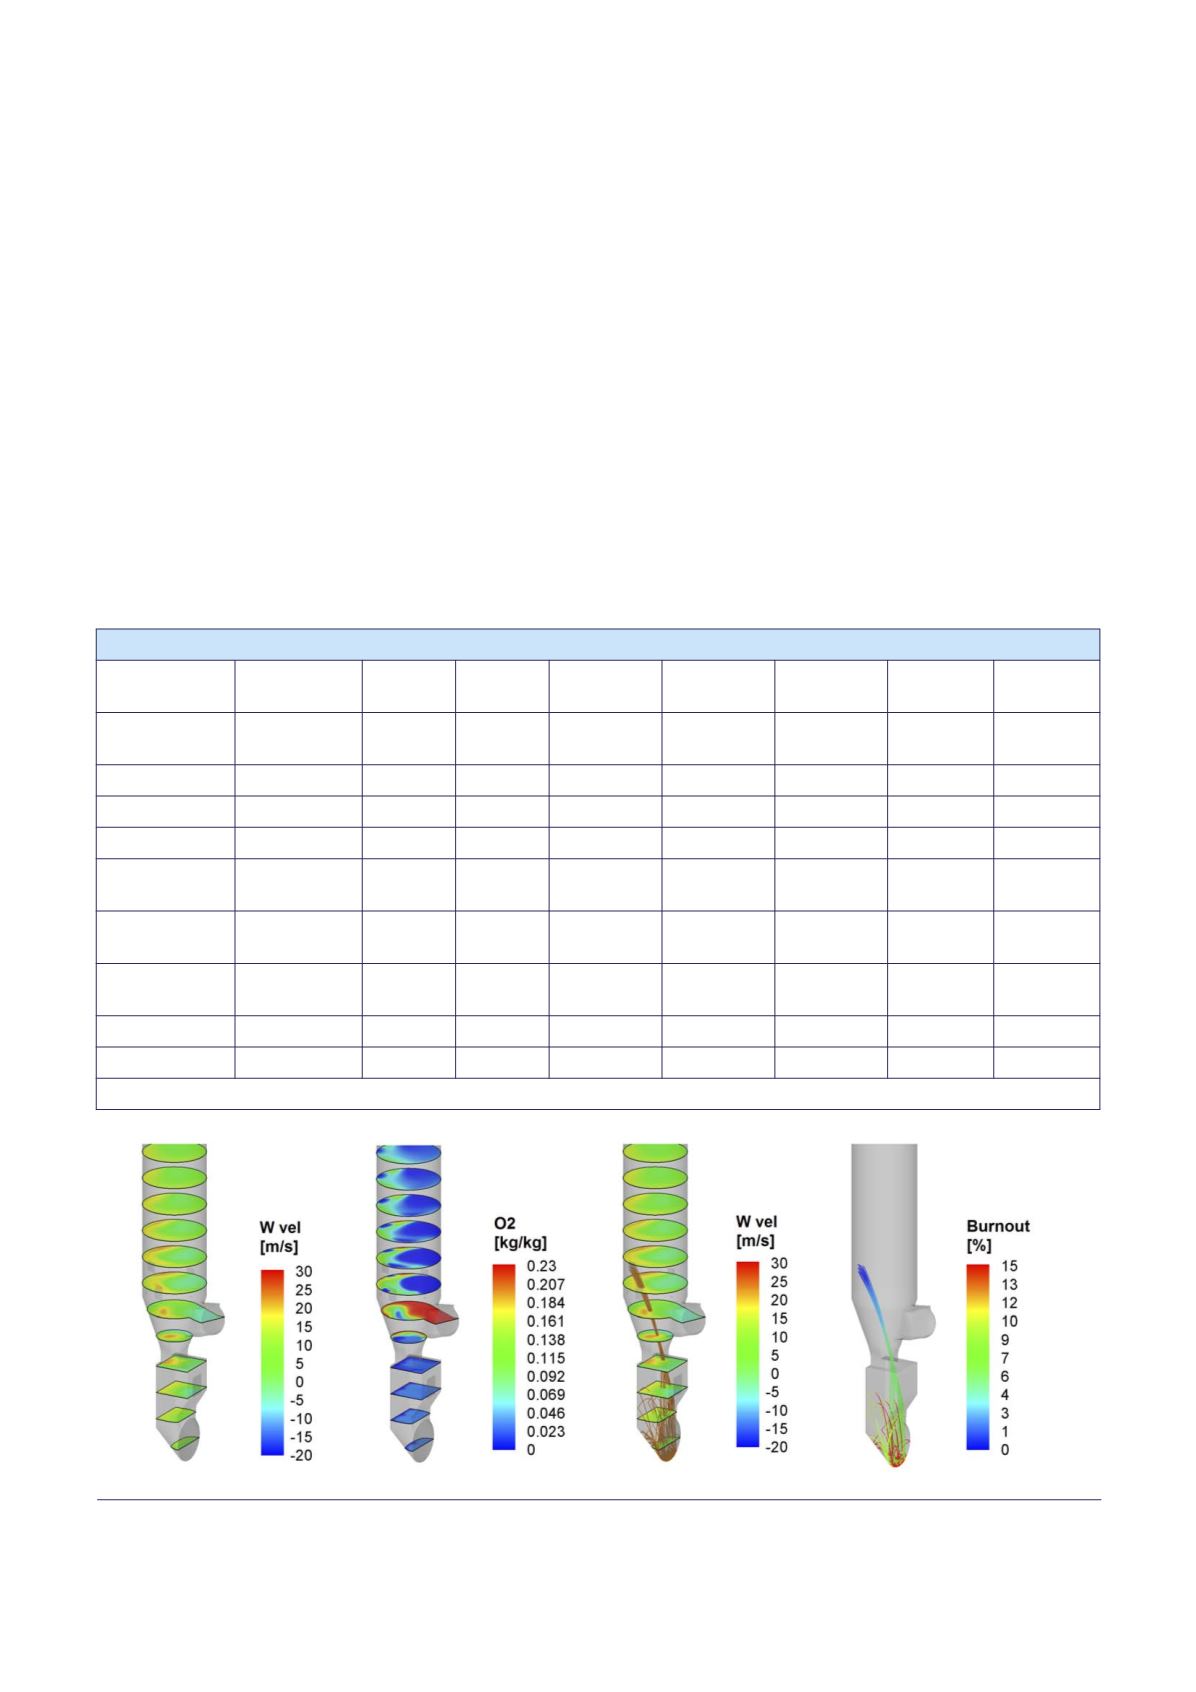
Figure 1. MI-CFD results for an inline calciner: (a) upward velocity profiles, (b) oxygen profiles, (c) upward velocity
profiles with tyre chip trajectories, and (d) evolution of tyre chips combustion.
(a)
(b)
(c)
(d)