


 12 / 60

10
World Cement
North America 2019
of almost 2%, the US is now approaching
zero growth. If not for immigration, the
country would already be at zero growth.
SC Market Analytics’ (SCMA) estimate for
future population growth is under 0.5%
through to 2024. Part of this is due to the
continued decline in domestic births per family
and part is due to lower immigration. When
used in isolation, it means a slowdown in
cement consumption. But this article will look
at the other factors behind cement demand
growth to see if they counter this drag from
slow population growth.
Another driver of cement demand is
migration among counties and states.
Large migration movements boost cement
demand for any given rate of population
growth, since growing areas need more of
all the construction segments (residential,
non‑residential, and non-building). Future
migration patterns will look like past migration
patterns with a few wrinkles. The Sunbelt will
continue to attract new people and companies,
due to lower taxes, lower home costs, and
lower business costs. In most cases these
attractors are getting stronger.
The Mountain states can now be added
to the list of destination sites for movers.
Lots of outdoor recreation, along with many
of the same attractors as the Sunbelt, is
boosting growth in the Mountain states.
More modest changes include improvements
in the old Rustbelt, due to a resurgence in
manufacturing, and slower growth along the
West Coast, as high prices and increasingly
restrictive business rules discourage business.
Areas that will do poorer are high tax, colder
areas of the country.
Housing is the largest investment and
asset for most families. Figure 3 shows that,
over time, housing has been a reasonably
good investment. However, the chart also
shows that rapid housing price growth
is unsustainable. Housing affordability is
impacted by mortgage rates, income growth,
and housing prices. The US is now in another
phase of high price growth experienced over a
short period of time. If the past is a prologue,
then the next five years will see little price
appreciation for the vast majority of areas.
But without a major economic downturn on
the horizon, price stagnation during the next
five years is more likely than a catastrophic
30% decline. Given that personal incomes are
growing, this will lead to more qualified buyers
but fewer buyers prepared to buy at the top
of the market. Hence, flat to somewhat slower
new home building activity is anticipated over
the next five years.
During the last 50 years, the federal budget
has only been balanced (or in a surplus
position) for four of those years. There
are multiple reasons for this: fast or slow
economic growth, wars, environmental
programmes, social programmes, etc.
No matter what the reason, spending has
almost always outpaced receipts. Since this
behaviour is unlikely to change, according to
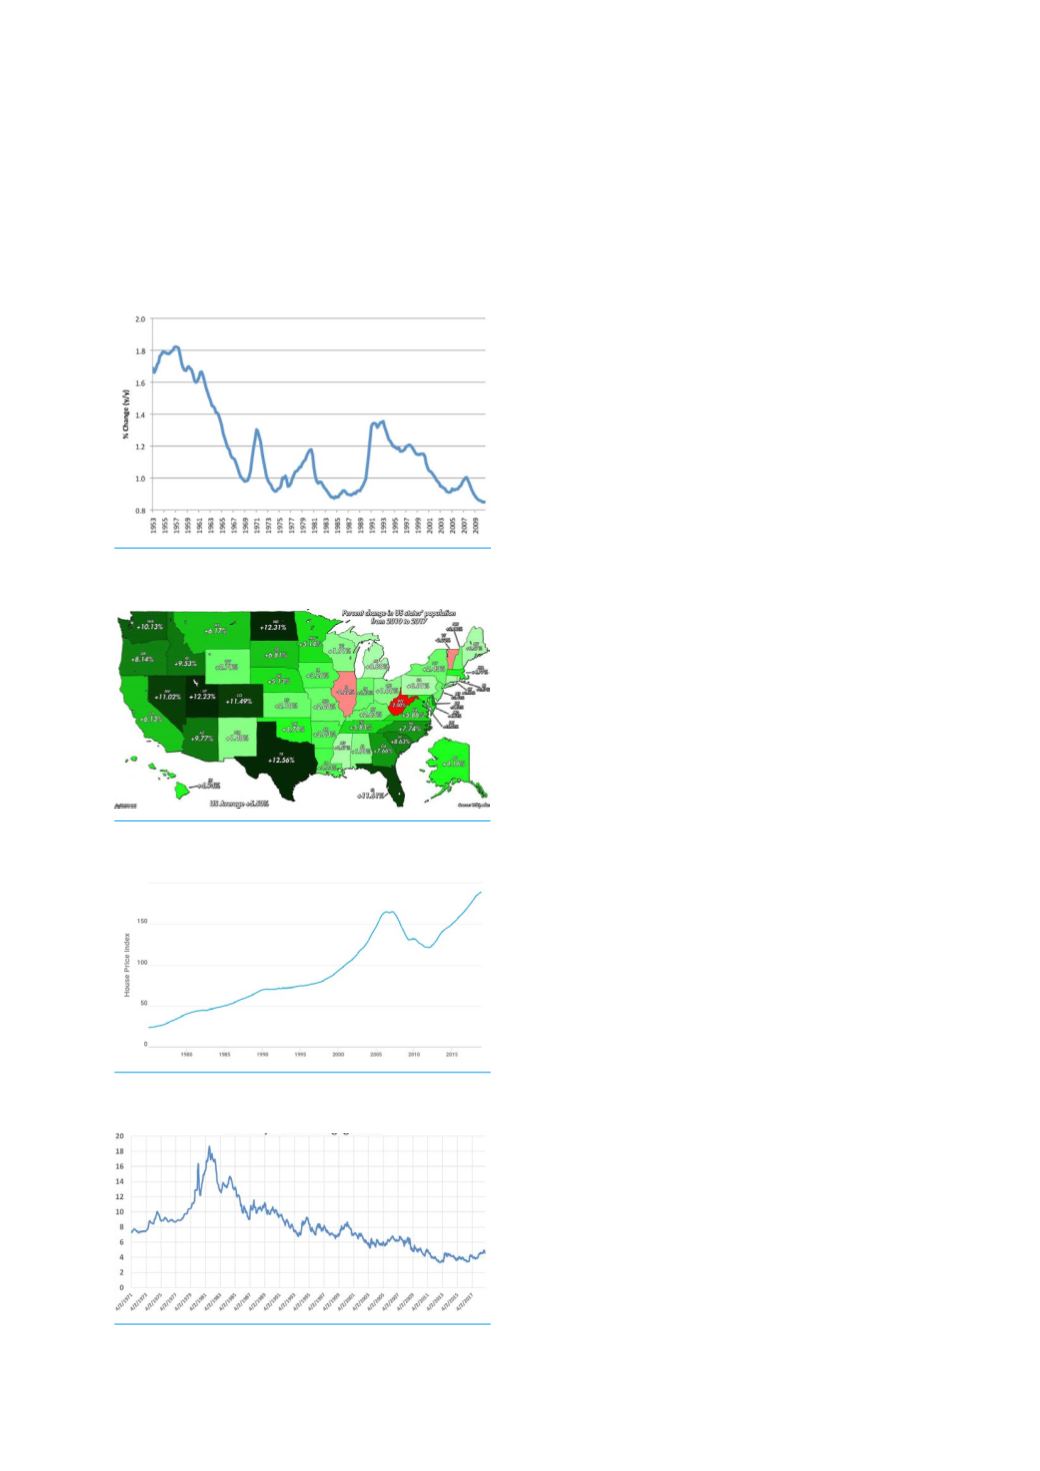
Figure 1. Growth rate of the US population
(%/year).
Figure 2. Percent change in the population of
US states from 2010 to 2017.
Figure 3. Housing price index (Freddie Mac
2000 = 100)
Figure 4. US 30 year fixed mortgage rate.